


Washington, DC…Total nonfarm payroll employment rose by 517,000 in January, and the unemployment rate changed little at 3.4 percent, the U.S. Bureau of Labor Statistics reported today. Job growth was widespread, led by gains in leisure and hospitality, professional and business services, and health care. Employment also increased in government, partially reflecting the return of workers from a strike.
This news release presents statistics from two monthly surveys. The household survey
measures labor force status, including unemployment, by demographic characteristics. The
establishment survey measures nonfarm employment, hours, and earnings by industry. For
more information about the concepts and statistical methodology used in these two surveys,
see the Technical Note.
_______________________________________________________________________________________
| |
| Changes to The Employment Situation Data |
| |
| Establishment survey data have been revised as a result of the annual benchmarking |
| process, the NAICS 2022 conversion, and the updating of seasonal adjustment factors. |
| Also, household survey data for January 2023 reflect updated population estimates. |
| See the notes at the end of this news release for more information. |
|_______________________________________________________________________________________|
Household Survey Data
Both the unemployment rate, at 3.4 percent, and the number of unemployed persons, at 5.7
million, changed little in January. The unemployment rate has shown little net movement
since early 2022. (See table A-1. See the note at the end of this news release and tables
B and C for more information about annual population adjustments to the household survey
estimates.)
Among the major worker groups, the unemployment rates for adult men (3.2 percent), adult
women (3.1 percent), teenagers (10.3 percent), Whites (3.1 percent), Blacks (5.4 percent),
Asians (2.8 percent), and Hispanics (4.5 percent) showed little change in January. (See
tables A-1, A-2, and A-3.)
The number of persons jobless less than 5 weeks decreased to 1.9 million in January. The
number of long-term unemployed (those jobless for 27 weeks or more) was essentially
unchanged at 1.1 million. The long-term unemployed accounted for 19.4 percent of the total
unemployed in January. (See table A-12.)
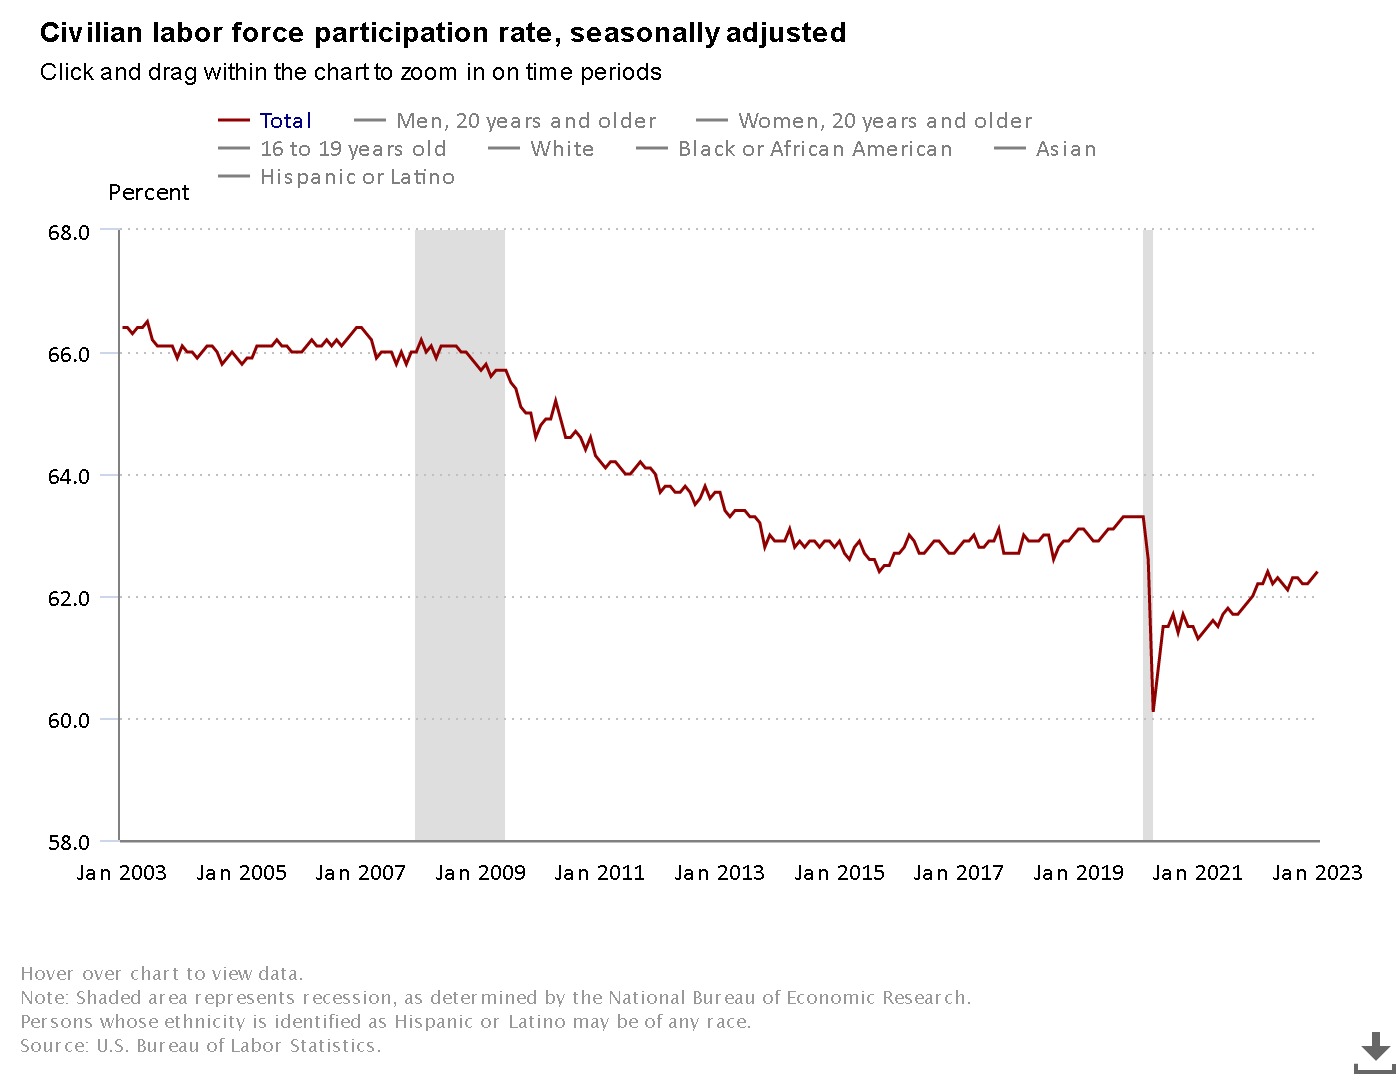
In January, both the labor force participation rate, at 62.4 percent, and the employment-
population ratio, at 60.2 percent, were unchanged after removing the effects of the annual
adjustments to the population controls. These measures have shown little net change since
early 2022 and remain below their pre-pandemic February 2020 levels (63.3 percent and 61.1
percent, respectively). (See table A-1. For additional information about the effects of
the population adjustments, see table C.)
The number of persons employed part time for economic reasons, at 4.1 million, was little
changed in January. These individuals, who would have preferred full-time employment, were
working part time because their hours had been reduced or they were unable to find full-
time jobs. (See table A-8.)
The number of persons not in the labor force who currently want a job was 5.3 million in
January, little changed from the prior month. These individuals were not counted as
unemployed because they were not actively looking for work during the 4 weeks preceding
the survey or were unavailable to take a job. (See table A-1.)
Among those not in the labor force who wanted a job, the number of persons marginally
attached to the labor force, at 1.4 million, changed little in January. These individuals
wanted and were available for work and had looked for a job sometime in the prior 12
months but had not looked for work in the 4 weeks preceding the survey. The number of
discouraged workers, a subset of the marginally attached who believed that no jobs were
available for them, was also little changed over the month at 342,000. (See Summary
table A.)
Establishment Survey Data
Total nonfarm payroll employment rose by 517,000 in January, compared with an average
monthly gain of 401,000 in 2022. Job growth was widespread in January, led by gains in
leisure and hospitality, professional and business services, and health care. Employment
also increased in government, partially reflecting the return of workers from a strike.
(See table B-1. See the note at the end of this new release and table A for more
information about the annual benchmark process.)
Leisure and hospitality added 128,000 jobs in January compared with an average of 89,000
jobs per month in 2022. Over the month, food services and drinking places added 99,000
jobs, while employment continued to trend up in accommodation (+15,000). Employment in
leisure and hospitality remains below its pre-pandemic February 2020 level by 495,000,
or 2.9 percent.
In January, employment in professional and business services rose by 82,000, led by gains
in professional, scientific, and technical services (+41,000). Job growth in professional
and business services averaged 63,000 per month in 2022.
Government employment increased by 74,000 in January. Employment in state government
education increased by 35,000, reflecting the return of university workers after a
strike.
Health care added 58,000 jobs in January. Job growth occurred in ambulatory health care
services (+30,000), nursing and residential care facilities (+17,000), and hospitals
(+11,000). In 2022, health care added an average of 47,000 jobs per month.
Employment in retail trade rose by 30,000 in January, following little net growth in
2022 (an average of +7,000 per month). In January, job gains in general merchandise
retailers (+16,000) and in furniture, home furnishings, electronics, and appliance
retailers (+7,000) were partially offset by a decline in health and personal care
retailers (-6,000).
Construction added 25,000 jobs in January, reflecting an employment gain in specialty
trade contractors (+22,000). Employment in the construction industry grew by an average
of 22,000 per month in 2022.
In January, transportation and warehousing added 23,000 jobs, the same as the industry’s
average monthly gain in 2022. Over the month, employment in support activities for
transportation increased by 7,000.
Employment in social assistance increased by 21,000 in January, little different from
the 2022 average gain of 19,000 per month.
Manufacturing employment continued to trend up in January (+19,000). In 2022,
manufacturing added an average of 33,000 jobs per month.
Employment showed little change over the month in other major industries, including
mining, quarrying, and oil and gas extraction; wholesale trade; information;
financial activities; and other services.
In January, average hourly earnings for all employees on private nonfarm payrolls rose
by 10 cents, or 0.3 percent, to $33.03. Over the past 12 months, average hourly
earnings have increased by 4.4 percent. In January, average hourly earnings of private-
sector production and nonsupervisory employees rose by 7 cents, or 0.2 percent, to
$28.26. (See tables B-3 and B-8.)
The average workweek for all employees on private nonfarm payrolls rose by 0.3 hour to
34.7 hours in January. In manufacturing, the average workweek increased by 0.4 hour to
40.5 hours, and overtime increased by 0.1 hour to 3.1 hours. The average workweek for
production and nonsupervisory employees on private nonfarm payrolls increased by 0.2
hour to 34.1 hours. (See tables B-2 and B-7.)
The change in total nonfarm payroll employment for November was revised up by 34,000,
from +256,000 to +290,000, and the change for December was revised up by 37,000, from
+223,000 to +260,000. With these revisions, employment gains in November and December
combined were 71,000 higher than previously reported. (Monthly revisions result from
additional reports received from businesses and government agencies since the last
published estimates and from the recalculation of seasonal factors. The annual
benchmark process also contributed to the November and December revisions.)
_____________
The Employment Situation for February is scheduled to be released on
Friday, March 10, 2023, at 8:30 a.m. (ET).
Revisions to Establishment Survey Data
In accordance with annual practice, the establishment survey data released today have
been benchmarked to reflect comprehensive counts of payroll jobs for March 2022. These
counts are derived principally from the Quarterly Census of Employment and Wages (QCEW),
which counts jobs covered by the Unemployment Insurance (UI) tax system. In addition,
the basis for industry classification in the establishment survey has been revised
from the 2017 North American Industry Classification System (NAICS) to NAICS 2022.
Approximately 10 percent of employment was reclassified into different industries as
a result of the NAICS revision. Implementation of NAICS 2022 resulted in major
revisions reflecting content and coding changes in the retail trade and information
sectors, as well as minor revisions within the mining and logging, manufacturing,
wholesale trade, financial activities, and other services sectors. Many industry
titles and descriptions were also updated to better reflect official NAICS titles.
Revisions due to both the NAICS 2022 conversion and the benchmark process affected
more historical data than typical in the annual benchmark process. The NAICS
revisions are reflected for the entire history of affected industries for both
seasonally and not seasonally adjusted data. Details of the updated titles and new,
discontinued, and collapsed industries (and resulting changes to tables B-1 through
B-9) are available at www.bls.gov/web/empsit/cesnewseries.htm.
The total nonfarm employment level for March 2022 was revised upward by 568,000
(+506,000 on a not seasonally adjusted basis, or +0.3 percent). The average not
seasonally adjusted benchmark revision (in absolute terms) over the past 10 years is
0.1 percent.
The over-the-year change in total nonfarm employment for March 2022 was revised from
+6,425,000 to +7,096,000 (seasonally adjusted). Table A presents revised total
nonfarm employment data on a seasonally adjusted basis from January to December 2022.
All revised historical establishment survey data are available on the BLS website at
www.bls.gov/ces/data/home.htm. In addition, an article that discusses the benchmark
and post-benchmark revisions and other technical issues is available at
www.bls.gov/web/empsit/cesbmart.htm.
Table A. Revisions to total nonfarm employment, January to December 2022, seasonally
adjusted
(Numbers in thousands)
—————————————————————————————
| |
| Level | Over-the-month change
|———————————————————————
Year and month | | As | | | As |
| As |previously | Difference| As |previously| Difference
| revised |published | | revised |published |
—————————————————————————————
| | | | | |
2022 | | | | | |
| | | | | |
January……… | 150,106 | 149,744 | 362 | 364 | 504 | -140
February…….. | 151,010 | 150,458 | 552 | 904 | 714 | 190
March……….. | 151,424 | 150,856 | 568 | 414 | 398 | 16
April……….. | 151,678 | 151,224 | 454 | 254 | 368 | -114
May…………. | 152,042 | 151,610 | 432 | 364 | 386 | -22
June………… | 152,412 | 151,903 | 509 | 370 | 293 | 77
July………… | 152,980 | 152,440 | 540 | 568 | 537 | 31
August………. | 153,332 | 152,732 | 600 | 352 | 292 | 60
September……. | 153,682 | 153,001 | 681 | 350 | 269 | 81
October……… | 154,006 | 153,264 | 742 | 324 | 263 | 61
November…….. | 154,296 | 153,520 | 776 | 290 | 256 | 34
December(p)….. | 154,556 | 153,743 | 813 | 260 | 223 | 37
—————————————————————————————
(p) = preliminary
Adjustments to Population Estimates for the Household Survey
Effective with data for January 2023, updated population estimates were incorporated
into the household survey. Population estimates for the household survey are developed
by the U.S. Census Bureau. Each year, the Census Bureau updates the estimates to
reflect new information and assumptions about the growth of the population since the
previous decennial census. The change in population reflected in the new estimates
results from adjustments for net international migration, updated vital statistics, and
improvements in estimation methodology.
In accordance with usual practice, BLS will not revise the official household survey
estimates for December 2022 and earlier months. However, to show the impact of the
population adjustments, table B displays differences in selected December labor force
series based on the old and new population estimates.
The adjustments increased the estimated size of the civilian noninstitutional
population in December by 954,000, the civilian labor force by 871,000, employment by
810,000, and unemployment by 60,000. The number of persons not in the labor force
increased by 82,000. Although the total unemployment rate was unaffected, the
employment-population ratio and labor force participation rate each increased by 0.1
percentage point.
Data users are cautioned that these annual population adjustments can affect the
comparability of household data series over time. Table C shows the effect of the
introduction of new population estimates on the change in selected labor force
measures between December 2022 and January 2023. Additional information on the
population adjustments and their effect on national labor force estimates is
available at www.bls.gov/web/empsit/cps-pop-control-adjustments.pdf.
Population controls for veterans, which are derived from a Department of Veterans
Affairs population model and are updated periodically, have also been updated with
the release of data for January 2023. Historical data have not been revised.
| Category | Total | Men | Women | White | Black or African Ameri- can |
Asian | Hispanic or Latino ethnicity |
|---|---|---|---|---|---|---|---|
| Civilian noninstitutional population | 954 | 869 | 84 | 309 | 153 | 437 | 291 |
| Civilian labor force | 871 | 857 | 14 | 365 | 168 | 291 | 289 |
| Participation rate | 0.1 | 0.2 | 0 | 0.1 | 0.2 | 0.1 | 0.2 |
| Employed | 810 | 812 | -2 | 335 | 149 | 282 | 271 |
| Employment-population ratio | 0.1 | 0.2 | 0 | 0.1 | 0.2 | 0.1 | 0.2 |
| Unemployed | 60 | 45 | 16 | 30 | 20 | 8 | 19 |
| Unemployment rate | 0 | 0 | 0 | 0 | 0.1 | 0 | 0.1 |
| Not in labor force | 82 | 13 | 71 | -56 | -15 | 146 | 2 |
| NOTE: Detail may not sum to totals because of rounding. Estimates for the above race groups (White, Black or African American, and Asian) do not sum to totals because data are not presented for all races. Persons whose ethnicity is identified as Hispanic or Latino may be of any race. | |||||||
| Category | Dec.-Jan. change, as published |
2023 population control effect |
Dec.-Jan. change, after removing the population control effect(1) |
|---|---|---|---|
| Civilian noninstitutional population | 1,118 | 954 | 164 |
| Civilian labor force | 866 | 871 | -5 |
| Participation rate | 0.1 | 0.1 | 0 |
| Employed | 894 | 810 | 84 |
| Employment-population ratio | 0.1 | 0.1 | 0 |
| Unemployed | -28 | 60 | -88 |
| Unemployment rate | -0.1 | 0 | -0.1 |
| Not in labor force | 252 | 82 | 170 |
| (1) This Dec.-Jan. change is calculated by subtracting the population control effect from the over-the-month change in the published seasonally adjusted estimates. | |||
|
NOTE: Detail may not sum to totals because of rounding. |
|||
Payrolls Soar by 517,000 in January Even with Tech Layoffs. Government adds 74,000 Jobs! added by News Desk on
View all posts by News Desk →