


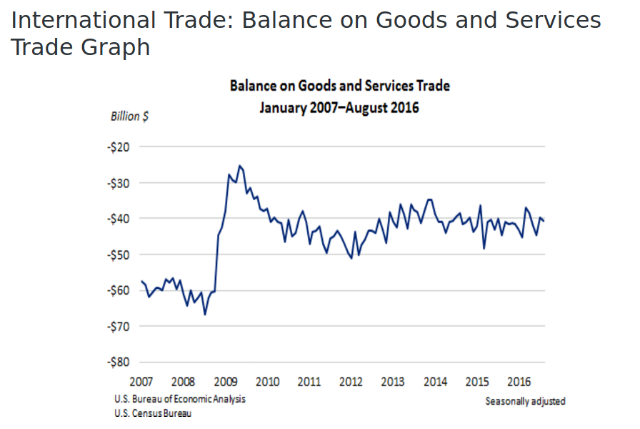
Washington, DC…The U.S. Census Bureau and the U.S. Bureau of Economic Analysis, through the Department of Commerce, announced today that the goods and services deficit was $40.7 billion in August, up $1.2 billion from $39.5 billion in July, revised. August exports were $187.9 billion, $1.5
billion more than July exports. August imports were $228.6 billion, $2.6 billion more than July
imports.
The August increase in the goods and services deficit reflected a decrease in the goods deficit
of less than $0.1 billion to $60.3 billion and a decrease in the services surplus of $1.2 billion
to $19.6 billion.
Year-to-date, the goods and services deficit decreased $4.3 billion, or 1.3 percent, from the
same period in 2015. Exports decreased $62.4 billion or 4.1 percent. Imports decreased $66.8
billion or 3.6 percent.
The average goods and services deficit decreased $0.4 billion to $41.6 billion for the three
months ending in August.
* Average exports of goods and services increased $2.2 billion to $185.7 billion in August.
* Average imports of goods and services increased $1.7 billion to $227.4 billion in August.
Year-over-year, the average goods and services deficit decreased $0.9 billion from the three
months ending in August 2015.
* Average exports of goods and services decreased $3.3 billion from August 2015.
* Average imports of goods and services decreased $4.2 billion from August 2015.
Exports of goods increased $1.2 billion to $125.3 billion in August.
Exports of goods on a Census basis increased $0.8 billion.
* Industrial supplies and materials increased $1.4 billion.
o Nonmonetary gold increased $0.9 billion.
* Automotive vehicles, parts, and engines increased $0.4 billion.
* Capital goods decreased $0.7 billion.
o Civilian aircraft decreased $0.8 billion.
Net balance of payments adjustments increased $0.4 billion.
Exports of services increased $0.3 billion to $62.5 billion in August.
* Travel (for all purposes including education) increased $0.2 billion.
* Transport, which includes freight and port services and passenger fares, increased $0.1
billion.
Imports of goods increased $1.1 billion to $185.6 billion in August.
Imports of goods on a Census basis increased $1.2 billion.
* Capital goods increased $1.2 billion.
o Civilian aircraft increased $0.6 billion.
o Telecommunications equipment increased $0.3 billion.
* Other goods increased $0.7 billion.
* Industrial supplies and materials decreased $0.8 billion.
o Nonmonetary gold decreased $1.4 billion.
Net balance of payments adjustments decreased less than $0.1 billion.
Imports of services increased $1.5 billion to $43.0 billion in August.
* Charges for the use of intellectual property increased $1.2 billion. The increase reflects
payments for the rights to broadcast the 2016 Summer Olympic Games.
* Travel (for all purposes including education) increased $0.2 billion.
The real goods deficit decreased $0.7 billion to $57.5 billion in August.
* Real exports of goods increased $2.2 billion to $123.0 billion.
* Real imports of goods increased $1.5 billion to $180.5 billion.
Revisions to July exports
* Exports of goods were revised upward $0.1 billion.
* Exports of services were revised downward less than $0.1 billion.
Revisions to July imports
* Imports of goods were revised upward $0.1 billion.
* Imports of services were revised upward $0.1 billion.
Goods by Selected Countries and Areas: Monthly – Census Basis
The August figures show surpluses, in billions of dollars, with Hong Kong ($2.4), South and
Central America ($1.7), Saudi Arabia ($0.8), Singapore ($0.7), United Kingdom ($0.4), and Brazil
($0.2). Deficits were recorded, in billions of dollars, with China ($29.2), European Union
($12.3), Japan ($5.7), Germany ($5.3), Mexico ($5.2), South Korea ($2.5), Italy ($2.4), France
($2.0), India ($1.9), Taiwan ($1.5), Canada ($1.1), and OPEC ($0.3).
* The surplus with Hong Kong increased $0.4 billion to $2.4 billion in August. Exports
increased $0.4 billion to $3.0 billion and imports increased less than $0.1 billion to $0.7
billion.
* The balance with Saudi Arabia shifted from a deficit of $0.2 billion to a surplus of $0.8
billion in August. Exports increased $1.3 billion to $2.5 billion and imports increased
$0.4 billion to $1.7 billion.
* The deficit with France increased $1.0 billion to $2.0 billion in August. Exports decreased
$0.6 billion to $2.3 billion and imports increased $0.4 billion to $4.3 billion.
NOTES:
* All statistics referenced are seasonally adjusted; statistics are on a balance of
payments basis unless otherwise specified. Additional statistics, including not seasonally
adjusted statistics and details for goods on a Census basis, are available in Exhibits 1-20b
of this release. For information on data sources, definitions, revision procedures, and
scheduled release dates through December 2017, see the information section on page A-1 of
this release. The next release is November 4, 2016.
* For definitions of goods on a balance of payments basis, goods on a Census basis, and net
balance of payments adjustments, see the information section on page A-1 of this release.
NOTICE
Updated Statistics on U.S. International Services and New Geographic Detail
On October 24, 2016, the U.S. Bureau of Economic Analysis (BEA) will release its most detailed
annual statistics on trade in services. This release will include expanded geographic detail and
statistics on digitally enabled services. For more information, see Updated Statistics on U.S.
International Services and New Geographic Detail.
If you have questions, please contact BEA’s Balance of Payments Division at
InternationalAccounts@bea.gov.
To learn more about the “U.S. International Trade in Goods and Services” report and other economic
indicators the U.S. Census Bureau publishes, join the Economic Indicators Division for the
“Investigating Economic Indicators” Webinar series. For more information,
visit www.census.gov/econ/webinar.
Increase In August Deficit For U.S. International Trade In Goods And Services added by News Desk on
View all posts by News Desk →