


Sacramento, CA…California’s unemployment rate remained at 8.3 percent in April as the state’s employers gained 101,800 non-farm payroll jobs1, according to data released today by the California Employment Development Department (EDD) from two surveys. This comes after March’s upwards-revised (+12,800 jobs) month-over gain of 132,400 jobs. Of the 2,714,800 total nonfarm jobs lost in March and April 2020 due to the COVID-19 pandemic, California has now regained 1,302,100 jobs (48 percent) since May 2020.
California’s Labor Market, by the Numbers…
- The unemployment rate of 8.3 percent in April2 is nearly half of the 16 percent peak hit one year ago, but is still 4 percent above the pre-pandemic level seen in February 2020.
- California’s April job gain accounts for 38 percent of the national gain of 266,000 jobs.
- From February through April, California added 390,300 total non-farm payroll jobs, marking the state’s third consecutive month of gains over 100,000 jobs.
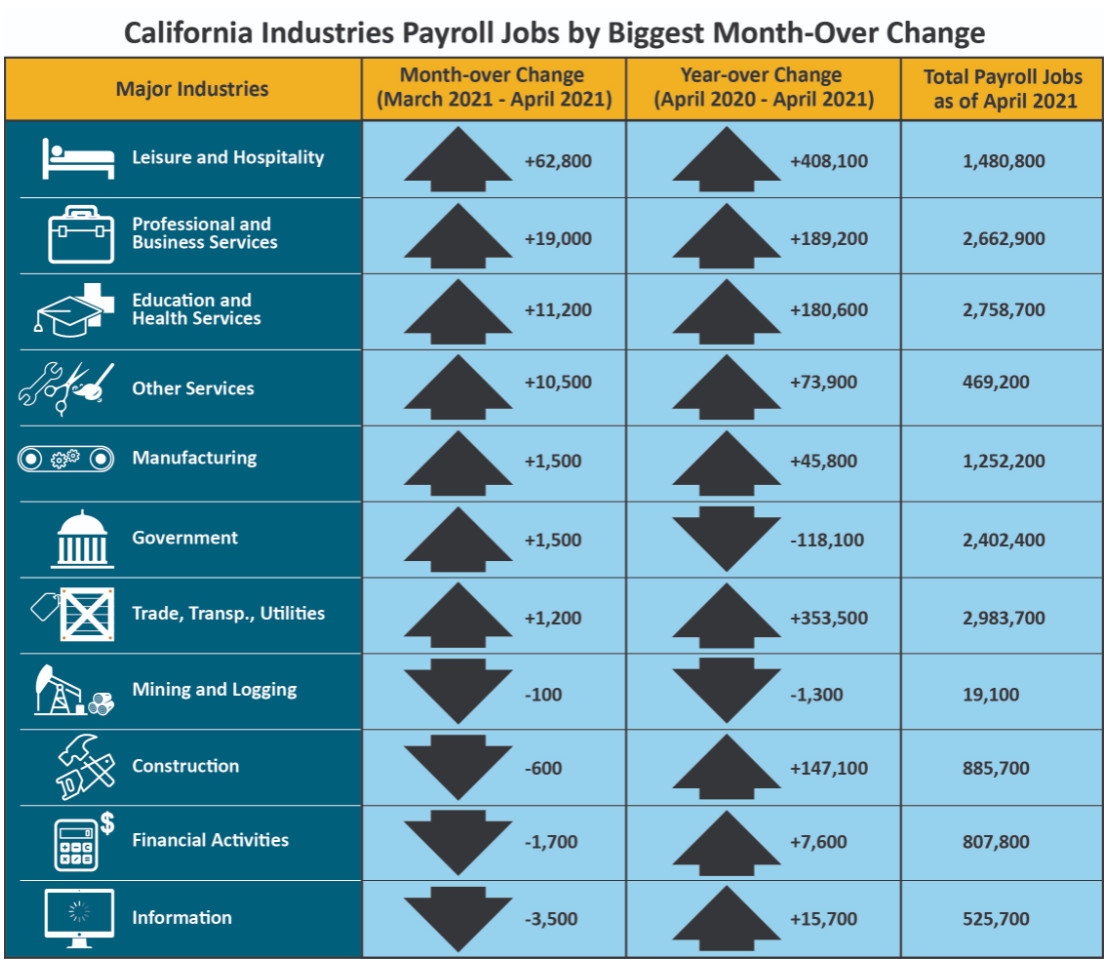
- Seven of California’s 11 industry sectors gained jobs in April. Leisure & Hospitality (+62,800) continued to have the state’s largest month-over increase thanks in large part to Full-Service Restaurants. Professional and Business Services (+19,000) also posted a large gain thanks to strength in Professional, Scientific, and Technical Services, as did Other Services (+10,500) with an increase in Personal Care Services.
- Leisure & Hospitality and Other Services, the hardest hit sectors during the pandemic, combined for nearly two-thirds of California’s job gains over the past three months.
- Information (-3,500) saw the largest month-over industry sector loss, largely due to a decrease in Software Publishers.
1. The nonfarm payroll job numbers come from a federal survey of 80,000 California businesses.
2. The unemployment rate comes from a separate federal survey of 5,100 California households.
Data Trends about Jobs in the Economy
Total Nonfarm Payroll Jobs
This comes from a monthly survey of approximately 80,000 California businesses that estimates jobs in the economy – seasonally adjusted.
- Month-over – Total nonfarm jobs in California’s 11 major industries totaled 16,248,200 in April – a net gain of 101,800 jobs from March 2021. This followed an upward revision of 12,800 jobs for a revised month-over gain of 132,400 jobs in March.
- Year-over – Total nonfarm jobs increased by 1,302,100 (an 8.7 percent increase) from April 2020 to April 2021 compared to the U.S. annual gain of 14,147,000 jobs (a 10.9 percent increase).
Total Farm jobs – The number of jobs in the agriculture industry decreased by 8,000 from March 2021 to 413,900 jobs in April. The agricultural industry had 44,700 more farm jobs in April 2021 than it did the April prior.
Data Trends about Workers in the Economy
Employment and Unemployment in California
This information is based on a monthly federal survey of 5,100 California households which focuses on workers in the economy.
- Employed – The number of Californians employed in April was 17,378,100, an increase of 36,800 jobs from March’s total of 17,341,300 and up 1,753,700 from the employment total in April of last year.
- Unemployed – The number of unemployed Californians was 1,576,100 in April, a decrease of 3,200 over the month and down 1,390,300 in comparison to April of last year.
Unemployment Insurance Claims (Not Seasonally Adjusted)
The following data is from a sample week that includes the 19th of each month: In related data that figures into the state’s unemployment rate, there were 579,498 people certifying for Unemployment Insurance benefits during the April 2021 sample week. That compares to 680,279 people in March and 1,889,250 people in April 2020. Concurrently, 78,640 initial claims were processed in the April 2021 sample week, which was a month-over decrease of 17,572 claims from March and a year-over decrease of 246,876 claims from April 2020.
| COUNTY | LABOR FORCE | EMPLOYMENT | UNEMPLOYMENT | RATE |
|---|---|---|---|---|
| STATE TOTAL | 18,812,400 | 17,292,400 | 1,520,000 | 8.1% |
| ALAMEDA | 795,300 | 745,000 | 50,200 | 6.3% |
| ALPINE | 540 | 500 | 40 | 8.0% |
| AMADOR | 14,270 | 13,270 | 990 | 7.0% |
| BUTTE | 91,500 | 85,000 | 6,500 | 7.1% |
| CALAVERAS | 21,100 | 19,850 | 1,250 | 5.9% |
| COLUSA | 10,710 | 9,320 | 1,390 | 13.0% |
| CONTRA COSTA | 530,200 | 495,000 | 35,200 | 6.6% |
| DEL NORTE | 9,210 | 8,460 | 750 | 8.1% |
| EL DORADO | 89,800 | 84,400 | 5,400 | 6.0% |
| FRESNO | 436,700 | 394,700 | 42,100 | 9.6% |
| GLENN | 12,640 | 11,760 | 870 | 6.9% |
| HUMBOLDT | 59,200 | 55,500 | 3,800 | 6.3% |
| IMPERIAL | 64,900 | 54,500 | 10,500 | 16.1% |
| INYO | 8,120 | 7,640 | 480 | 6.0% |
| KERN | 372,700 | 332,600 | 40,100 | 10.7% |
| KINGS | 54,700 | 49,100 | 5,600 | 10.2% |
| LAKE | 28,740 | 26,550 | 2,190 | 7.6% |
| LASSEN | 9,480 | 8,920 | 560 | 5.9% |
| LOS ANGELES | 5,110,500 | 4,548,100 | 562,400 | 11% |
| MADERA | 60,200 | 54,500 | 5,700 | 9.5% |
| MARIN | 129,600 | 123,600 | 6,000 | 4.6% |
| MARIPOSA | 6,820 | 6,260 | 560 | 8.2% |
| MENDOCINO | 36,000 | 33,640 | 2,360 | 6.5% |
| MERCED | 114,100 | 101,600 | 12,500 | 10.9% |
| MODOC | 3,290 | 3,040 | 250 | 7.5% |
| MONO | 7,430 | 6,870 | 550 | 7.4% |
| MONTEREY | 215,600 | 197,000 | 18,600 | 8.6% |
| NAPA | 67,700 | 63,500 | 4,200 | 6.3% |
| NEVADA | 45,440 | 42,760 | 2,680 | 5.9% |
| ORANGE | 1,536,000 | 1,440,500 | 95,500 | 6.2% |
| PLACER | 183,300 | 173,700 | 9,700 | 5.3% |
| PLUMAS | 7,350 | 6,640 | 710 | 9.7% |
| RIVERSIDE | 1,099,100 | 1,016,000 | 83,200 | 7.6% |
| SACRAMENTO | 700,800 | 650,500 | 50,300 | 7.2% |
| SAN BENITO | 31,100 | 28,700 | 2,400 | 7.7% |
| SAN BERNARDINO | 965,700 | 891,300 | 74,500 | 7.7% |
| SAN DIEGO | 1,517,500 | 1,415,400 | 102,100 | 6.7% |
| SAN FRANCISCO | 540,500 | 511,600 | 28,900 | 5.4% |
| SAN JOAQUIN | 328,100 | 298,700 | 29,500 | 9.0% |
| SAN LUIS OBISPO | 128,300 | 121,100 | 7,200 | 5.6% |
| SAN MATEO | 424,000 | 403,400 | 20,500 | 4.8% |
| SANTA BARBARA | 216,300 | 203,300 | 12,900 | 6.0% |
| SANTA CLARA | 1,003,800 | 953,900 | 49,900 | 5.0% |
| SANTA CRUZ | 129,400 | 119,400 | 10,000 | 7.7% |
| SHASTA | 72,500 | 67,400 | 5,100 | 7.0% |
| SIERRA | 1,280 | 1,190 | 90 | 6.7% |
| SISKIYOU | 16,620 | 15,270 | 1,350 | 8.1% |
| SOLANO | 199,300 | 184,200 | 15,100 | 7.6% |
| SONOMA | 238,300 | 224,600 | 13,700 | 5.7% |
| STANISLAUS | 237,800 | 217,300 | 20,400 | 8.6% |
| SUTTER | 44,000 | 39,800 | 4,200 | 9.6% |
| TEHAMA | 25,090 | 23,240 | 1,860 | 7.4% |
| TRINITY | 4,440 | 4,150 | 300 | 6.6% |
| TULARE | 196,900 | 175,100 | 21,700 | 11.0% |
| TUOLUMNE | 19,510 | 18,000 | 1,510 | 7.8% |
| VENTURA | 405,200 | 380,100 | 25,000 | 6.2% |
| YOLO | 105,100 | 98,700 | 6,400 | 6.0% |
| YUBA | 29,000 | 26,400 | 2,600 | 9.1% |
California Economy Adds 101,800 Jobs in April. Unemployment Rate Holds at 8.3% added by News Desk on
View all posts by News Desk →